USA
New York | October 2011
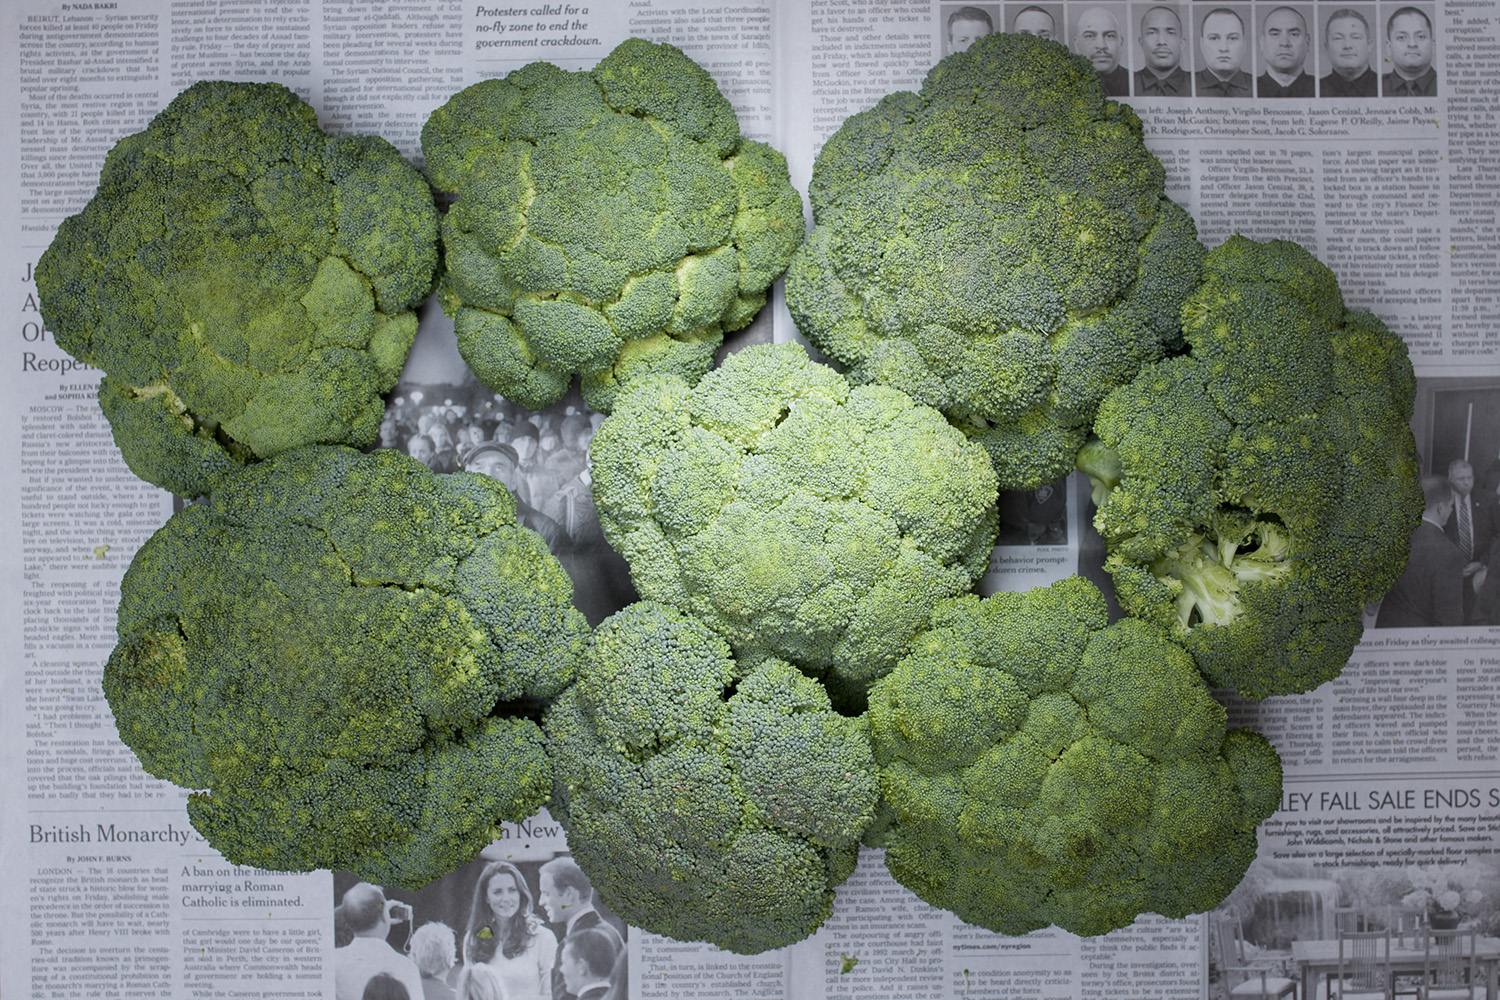
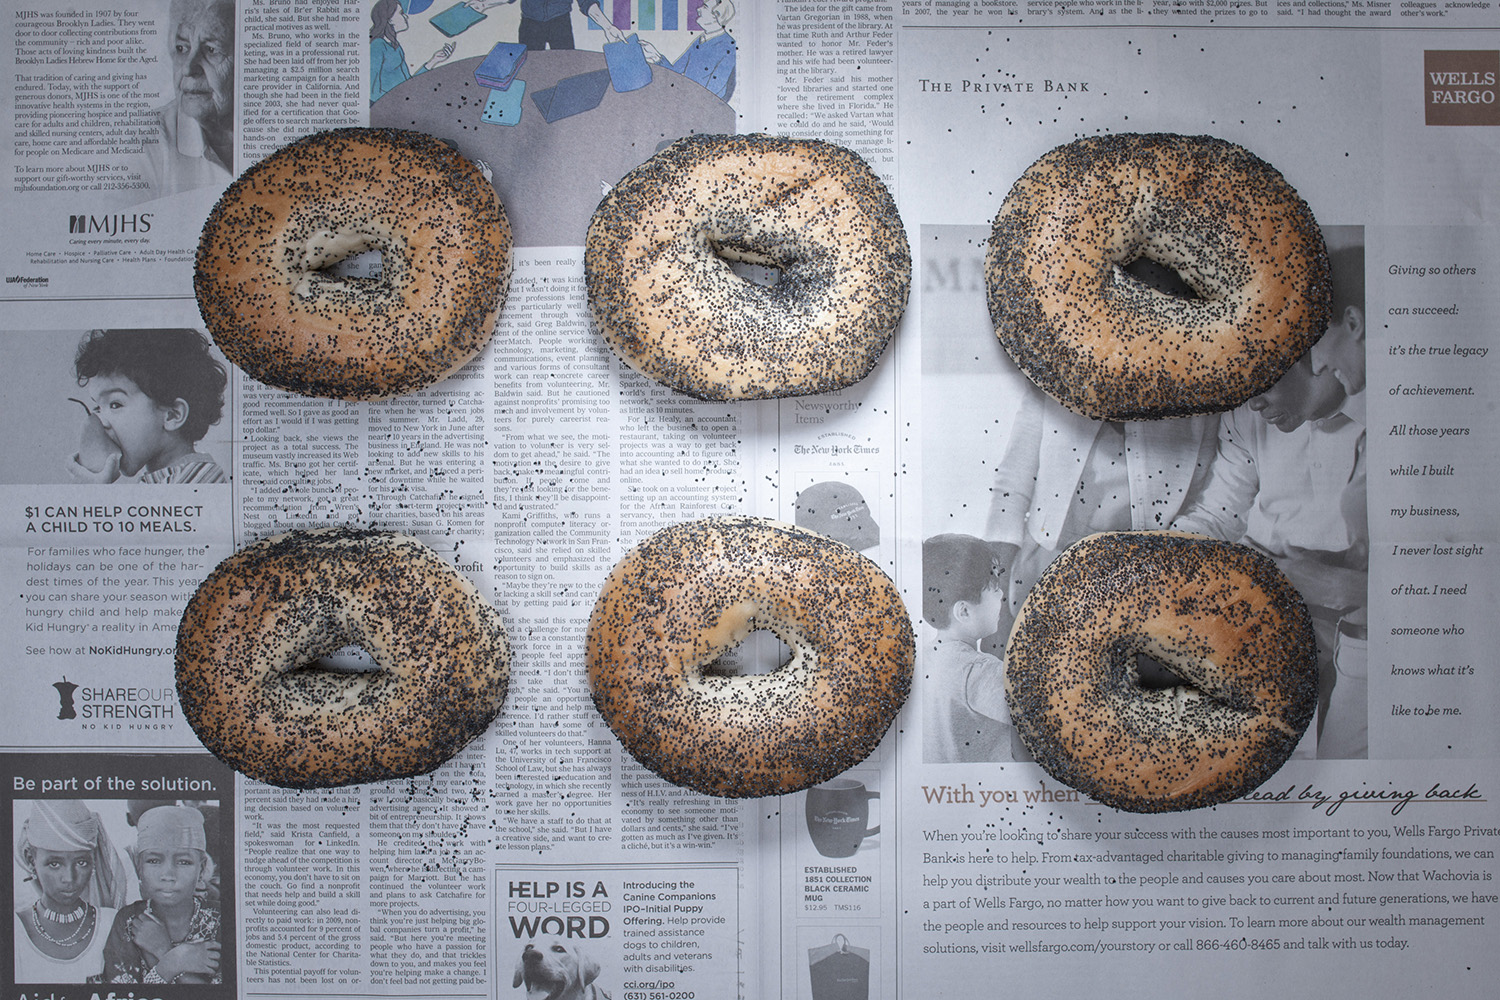
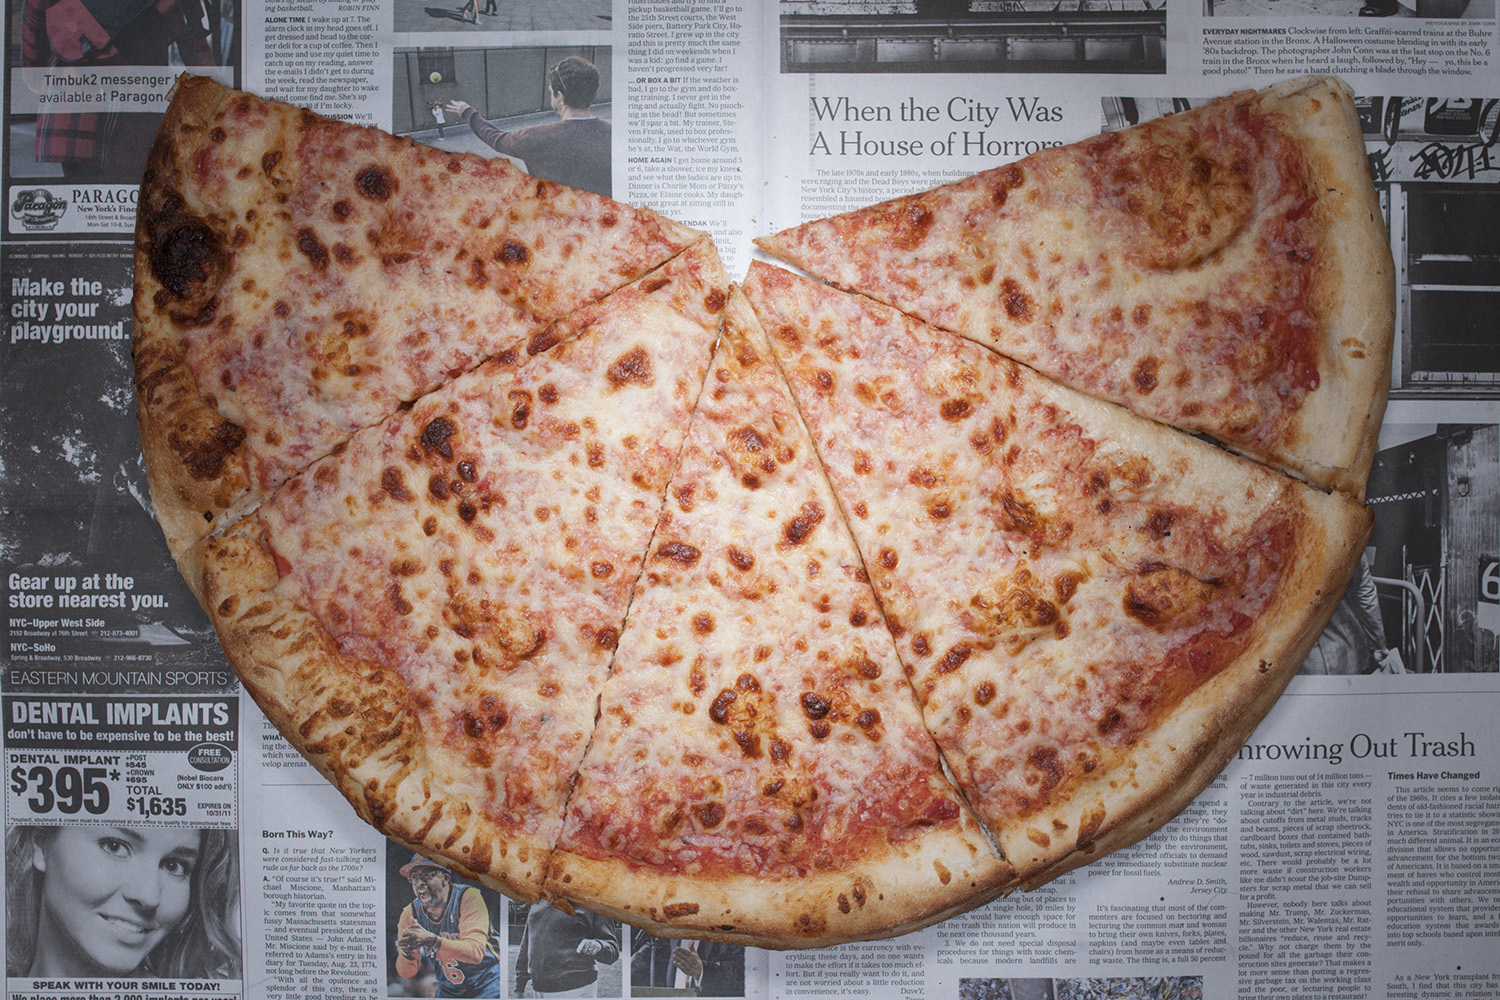
USD 31.08; USD 4.91 (EUR 3.60) for food.
This is based on per capita per-day basis of the poverty threshold (set for single-person, under age 65 households, the most common structure of poor households), and low-income household food expenditure.

In 2010, the USA's poverty rate was 15.1 %, with 46.2 million people earning under the poverty line. This number is the highest in the 52 years that the poverty estimates have been released, revealing the impact of the economic recession especially on working-class families. About one-third of the poor were from suburban areas, and 22% of American children under 18 years old were considered poor.
The national poverty line was originally developed in 1963-1964 based on a nutritionally adequate diet. Different poverty threshold rates are set for different household structures, involving pretax income not including noncash benefits. Official poverty data is published by the Census Bureau, while many government aid programs use other poverty measures.
In September 2011, after the release of the 2010 annual poverty data, public discussion arose surrounding uneven wealth distribution and whether the measure accurately portrayed poverty conditions. Subsequently, the Census Bureau introduced a new supplementary measure in November 2011, which accounts for other aspects such as tax payments, work expenses, and geographic adjustments for housing cost differences.
Understanding More
Income, Poverty and Health Insurance in the United States: 2010
The Changing Face of Poverty in America
Supplementary Poverty Research
Older, Suburban and Struggling, ‘Near Poor’ Startle the Census