United Kingdom
London | December 2013
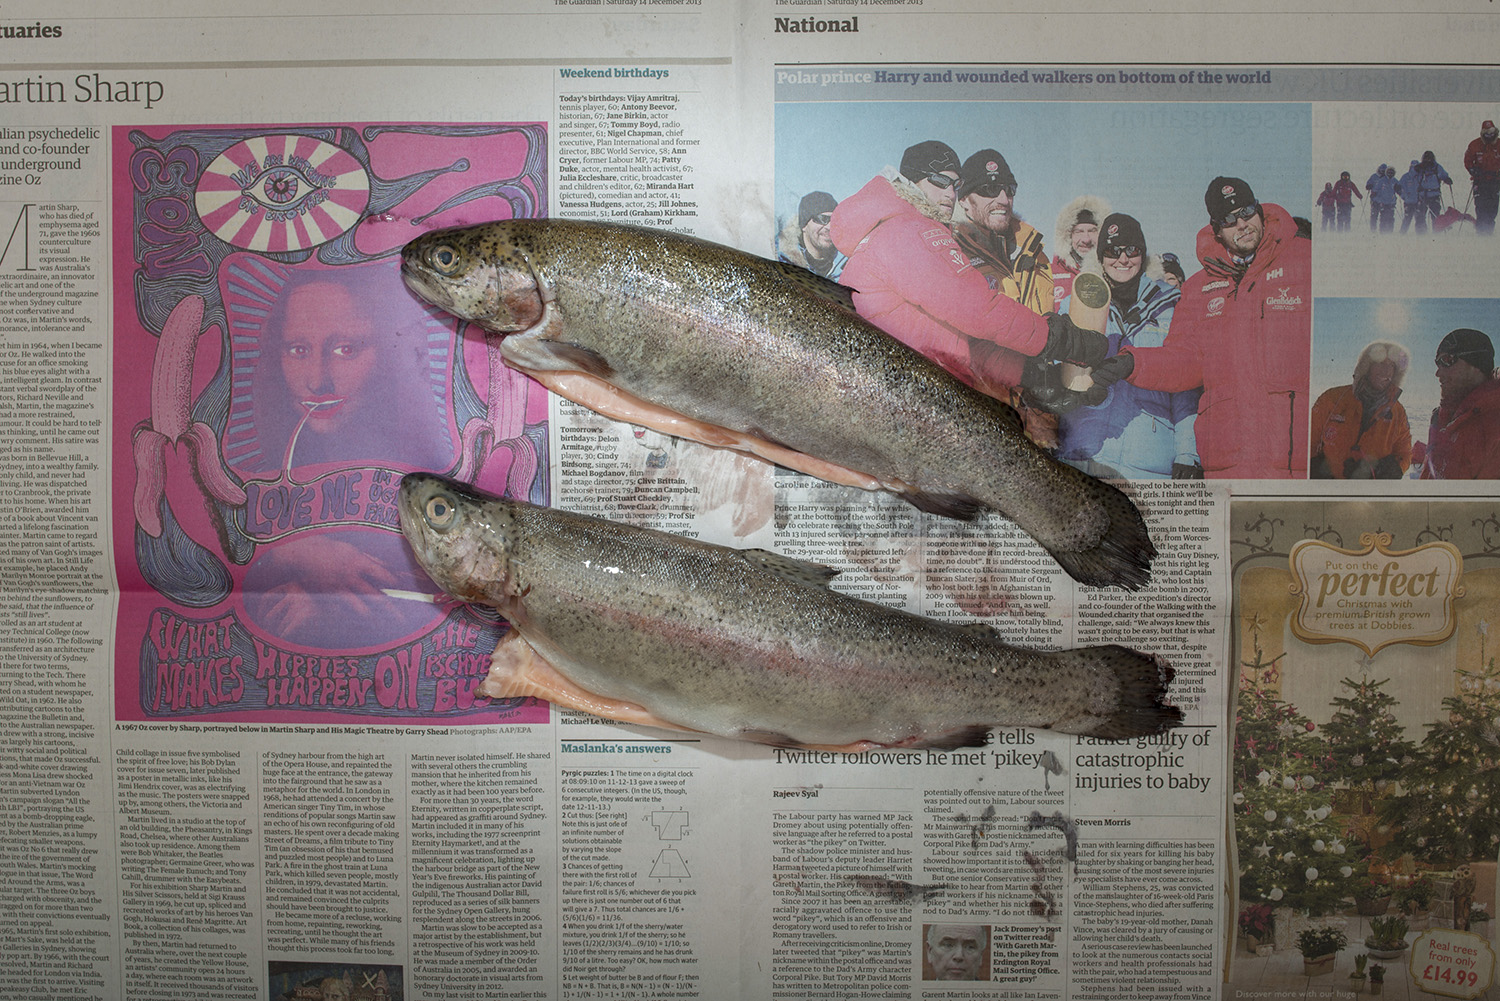
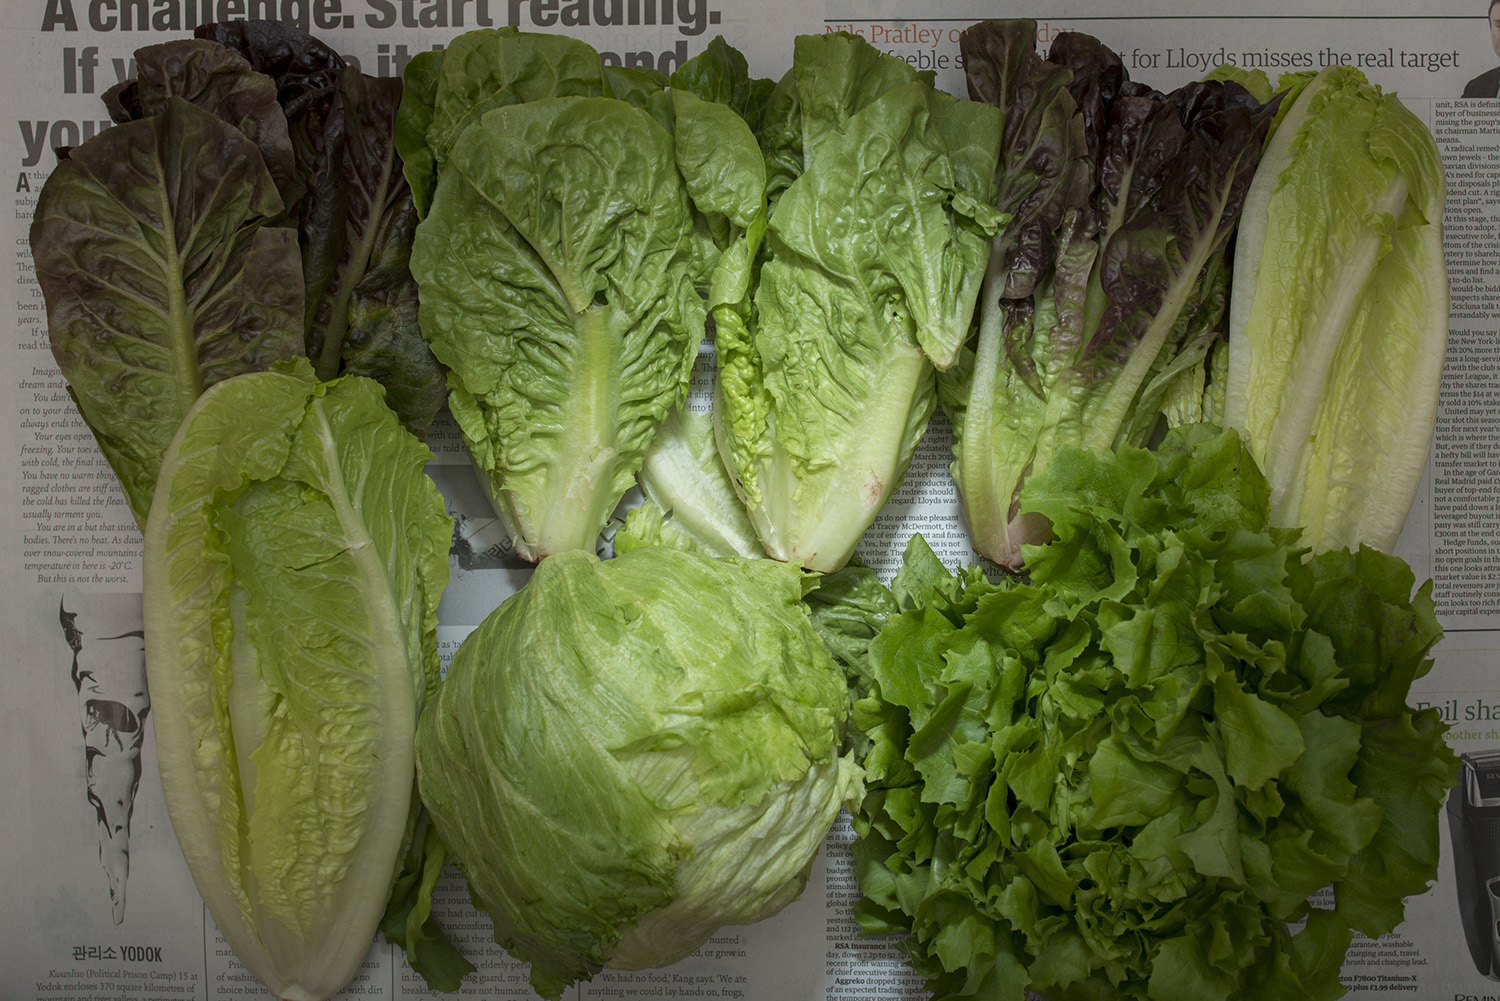
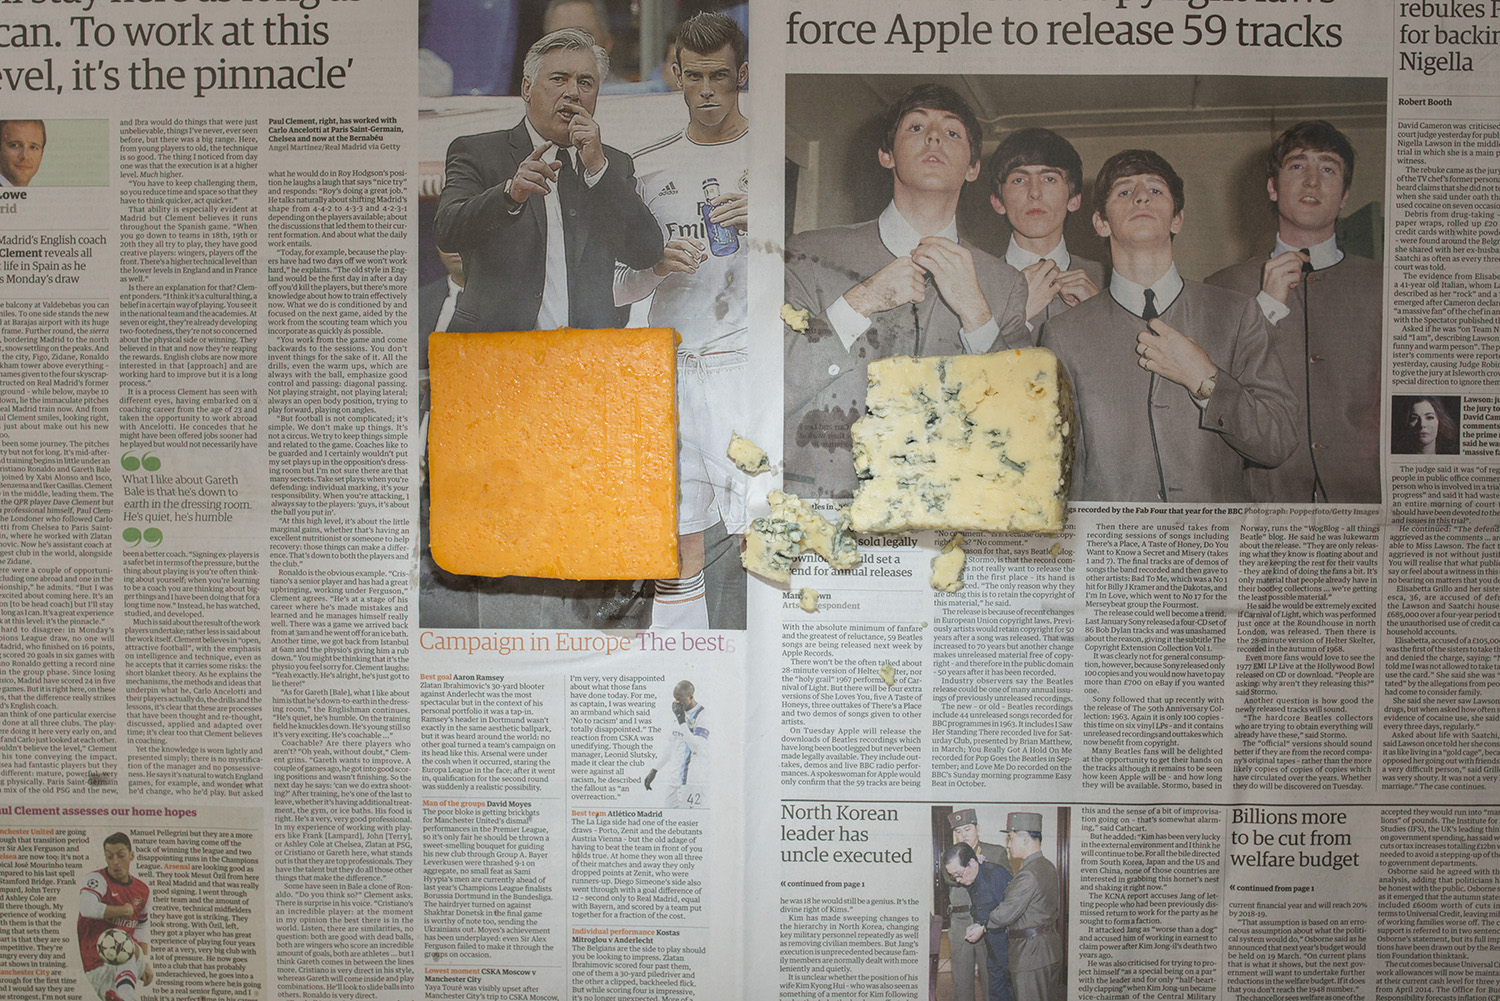
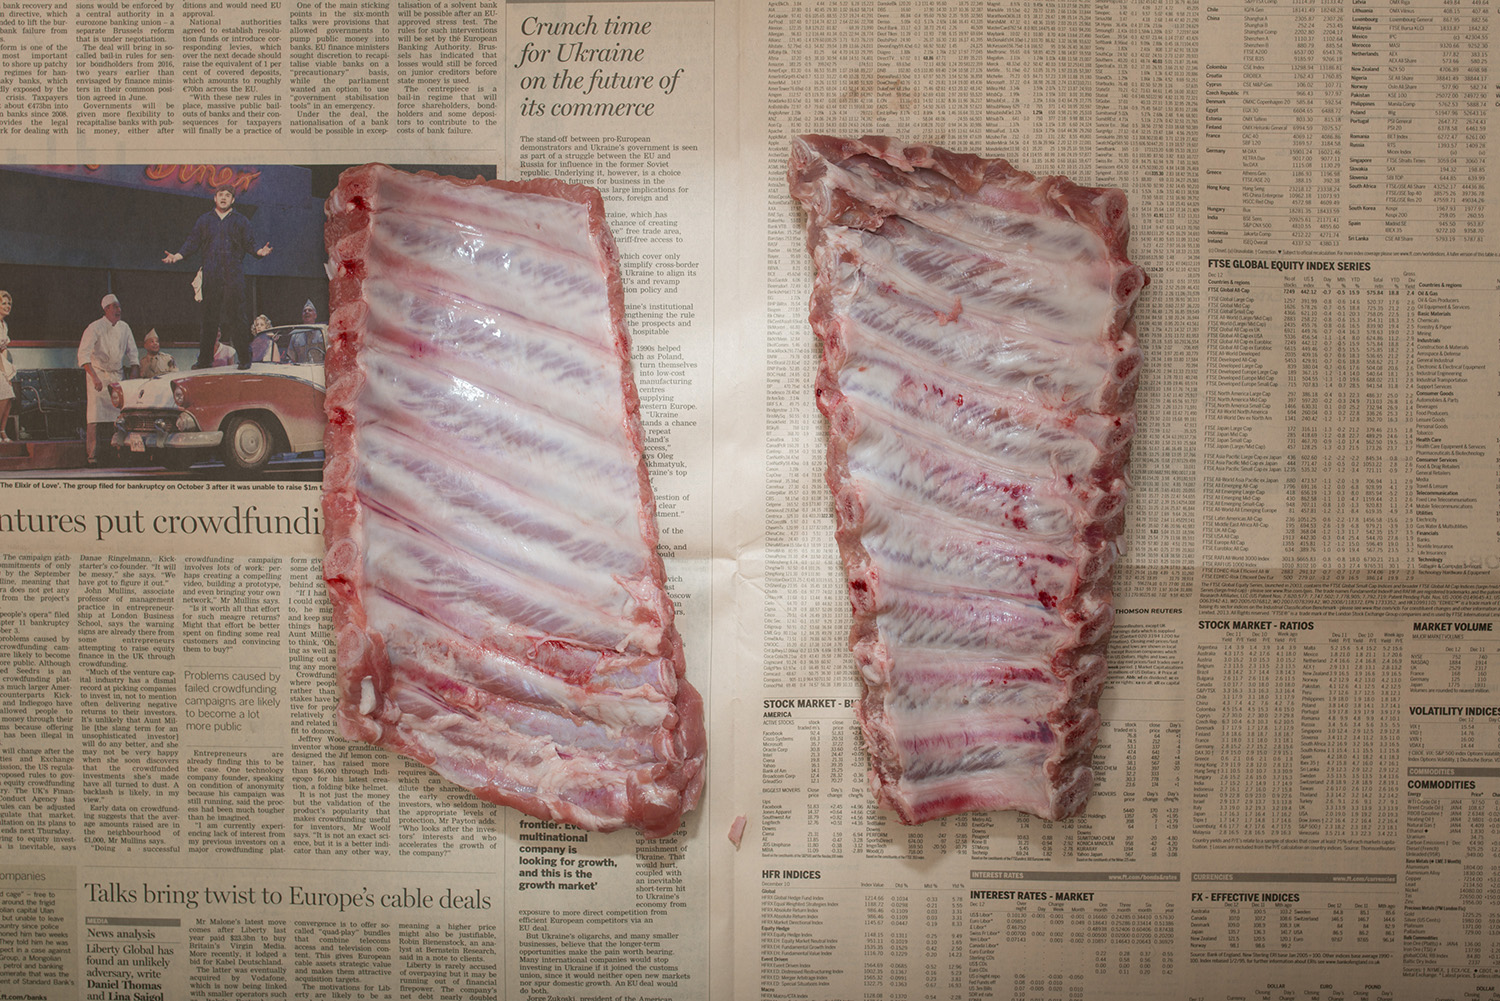
GBP 36.57; GBP 5.85 (USD 9.47, EUR 7.01) for food.
This is based on per capita per-day basis of UK’s relative poverty line, lowest decile income household food and non-alcoholic beverage expenditure.
In 2011/12, UK’s poverty rate was 16%, with 9.8 million people earning below the poverty line. Child poverty is a widely argued issue, with 17% of children in relative low income in 2011/12. Another related issue is fuel poverty, which is defined as when more than 10% of income is spent on fuel to keep warm. More than five million UK households are considered to be living in fuel poverty.
UK uses a relative low income definition, which is 60% of median net household equivalised income before housing costs (households below average income). Annual national statistics on people living in low-income households are released by the UK Department for Work and Pensions, which works with the UK Statistics Agency. The UK Statistics Agency conducts surveys on Family Resources and Living Costs and Food.
Note: Latest available standards and exchange rates were taken as of December 2013, when the photography was undertaken.
Understanding More
Households below average income (HBAI): 1994/95 to 2012/13
Poverty Figures: Number of Poor Falls
Poverty hits twice as many British households as 30 years ago